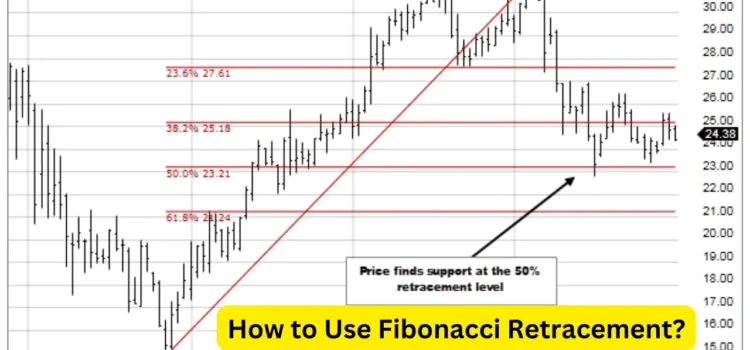
Market trends are very essential to successful trading in the world of finance. One of the tools that traders find useful is Fibonacci retracements. These retracements are derived from a mathematical sequence discovered by Leonardo Fibonacci centuries ago. By drawing these levels on price charts, traders can estimate possible support and resistance levels for the market.
This article will discuss how you can use Fibonacci Retracement in your trading activities.
What Is a Fibonacci Retracement?
Fibonacci retracement is an analysis tool used by traders to determine probable support and resistance levels in a financial market. This is based on the Fibonacci sequence and ratios such as 23.6%, 38.2%, 50%, 61.8% and 78.6%.
Prices are charted at these levels to show where prices could temporarily reverse or “retrace” within a larger trend.
Traders use Fibonacci retracements to know when they should get into trades or leave them, as well as for risk management through stop-loss orders and profit targets.
How to Use Fibonacci Retracement?
Traders who want to find potential areas of resistance or support in the market can really benefit from using Fibonacci retracement levels. Now let us look into how you can use it step by step.
1. Identify the Peak and Trough
The first thing you should do when using Fibonacci retracement is to recognize the peak and trough from a price chart.
The highest point reached by the price in a given period is called the peak, while the lowest point is referred to as the trough. This complete price swing or market movement for this timeframe can be represented by these two points.
It is, therefore, important to note that these levels will be drawn between these two points of trough and peaks to provide a foundation for analysis. Thus, this stage lays the groundwork for the application of the Fibonacci retracement tool.
2. Draw the Fibonacci Levels
The second step in Fibonacci retracement is drawing the Fibonacci levels. This is done by connecting the identified peak and trough using the Fibonacci retracement tool.
The direction of drawing depends on the trend. In an uptrend, the levels are drawn from low (trough) to high (peak). Conversely, in a downtrend, the levels are drawn from high (peak) to low (trough).
This step is essential as it establishes the potential retracement levels, which are key to identifying possible support and resistance levels in the market.
3. Identify the Retracement Levels
This step is to identify the retracement levels. These are the key percentages: 23.6%, 38.2%, 50%, 61.8%, and 78.6%. These percentages represent how much of the prior move the price has retraced. They are derived from Fibonacci numbers and are used to identify potential support and resistance levels.
These levels are where the price could potentially reverse or pause. Traders watch these levels closely as they can provide potential trade entry points.
This step is crucial for planning trades based on Fibonacci retracement.
4. Apply the Levels to Your Trading
The final step in Fibonacci retracement involves applying the levels to your trading. Traders use these levels to identify potential areas for trade.
In an uptrend, traders look to buy at a Fibonacci support level, while in a downtrend, they look to sell at a Fibonacci resistance level. These levels can offer potential entry and exit points for trades.
However, it’s important to remember that these are predictive indicators and should be used in conjunction with other indicators and risk management techniques to increase the probability of successful trades.
Conclusion
Learning about Fibonacci retracements can boost your trading skills significantly. By grasping these levels and using them in your analysis, you can better predict market changes.
Remember, practice and ongoing learning are vital for success in trading. If you’re interested in learning the course on technical analysis, enroll on Upsurge.club. They also offer the stock market course in hindi and english, helping you become a more confident trader.
For more information visit our homepage.


