Introduction
In today’s data-driven world, businesses are creating and collecting more information than ever before. This surge of data provides an opportunity for organizations to glean insight, inform decision-making, and drive strategy. However, to leverage this potential, that data must be accurately understood, and this is where data visualization comes in. As a fundamental element of business intelligence, data visualization provides a quick, clear, and comprehensive way of understanding patterns, trends, and correlations in data. It transforms raw data into visual graphics, such as charts or maps, to allow for easier interpretation and consumption. Below, we delve deeper into the top data visualization methods used in the business world.
Understanding Data Through Radar Charts
A slightly more complex but highly versatile visualization method is the radar chart. This chart type plots multi-variable data on a two-dimensional chart and allows a clear comparison of different variables or items. The name comes from the spokes that radiate from the center, giving the chart a radial appearance.
Radar charts are an effective tool when visualizing performance results, as each variable is given equal importance, providing a comprehensive overview. They’re routinely used across various industries, from sports to finance, to compare a variety of performance metrics.
Despite the complexity of radar charts, when used correctly, they present comparative data in a succinct and easy-to-understand format. The application of radar charts in business data visualization can help users analyze complex data sets and consolidate insights into an easily digestible visual format.
The Dominance of Bar Charts and Line Charts

Bar charts and line charts are the staples of data visualization and are utilized frequently due to their simplicity and versatility. Bar graphs, which utilize rectangular bars to represent data, are ideal when comparing different categories of data. Their length or height corresponds to the quantity they represent, effectively displaying comparative differences. As such, they’re extremely effective in showing the relationship between one or more categorical data types and numerical data.
Line charts, on the other hand, are best suited when illustrating the changes in data over a period of time. They plot individual data points connected by a line, creating a timeline of sorts that outlines changes more clearly. This makes line charts invaluable for understanding trends, forecasting, and tracking progress over time.
These two types of graphs are seen as the cornerstones of data visualization because of their intuitiveness and simplicity. In many situations, they’re the optimal choice for communicating data, especially to audiences that aren’t necessarily data-savvy. Their universal recognition ensures that the message remains clear, regardless of the audience’s background or expertise.
The Power of Pie Charts

Pie graphs, also known as pie charts, are a valuable tool in business data analytics. They provide a visual representation of data, making it easier for individuals and organizations to understand complex information at a glance. With their circular shape, pie graphs divide the data into segments or slices, with each slice representing a specific category or variable.
The primary advantage of using pie graphs in business data analytics is their ability to show the relative proportions or percentages of different components within a dataset. By comparing the size of each slice to the overall pie, decision-makers can quickly identify trends, patterns, and outliers. This visual representation helps in making data-informed decisions related to resource allocation, identifying areas of improvement, and understanding market share and customer preferences.
Monitoring With Dashboards
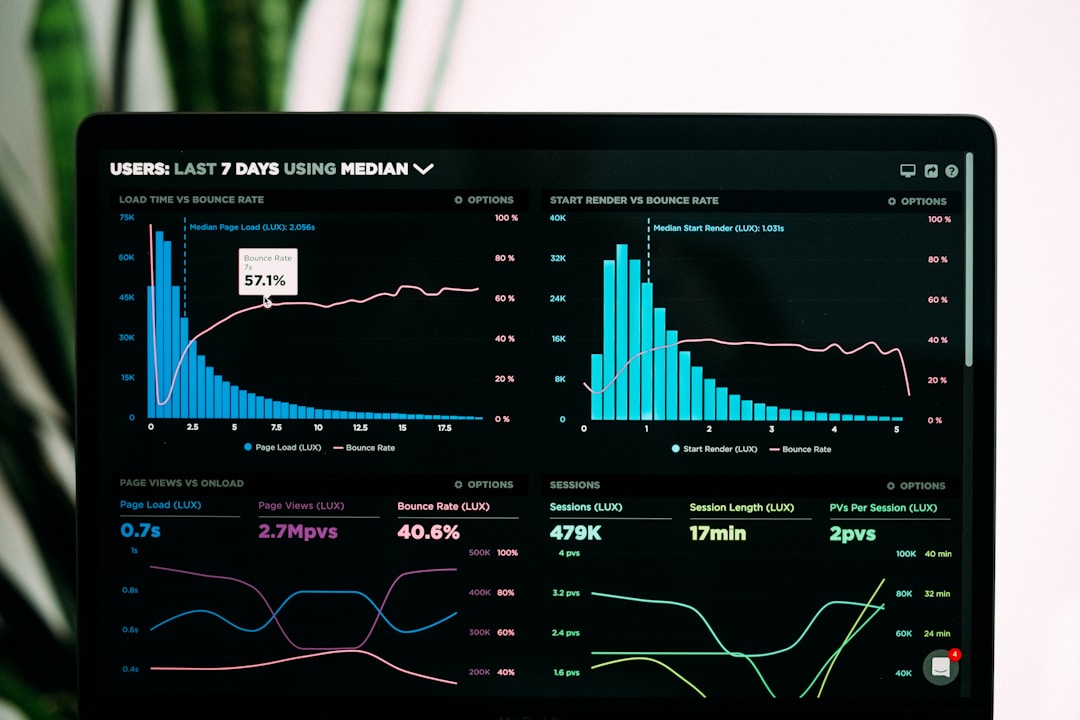
Dashboards are arguably the soul of business data visualization. They integrate various visualization tools to display an overall snapshot of business performance. Dashboards are interactive, allowing users to change parameters and time intervals or even drill down for more detailed data.
Dashboards are most commonly used to monitor real-time data and key performance indicators in a cohesive and convenient display. This provides businesses with the power to quickly spot trends, manage operations, and make strategic, informed decisions in a timely manner.
User-friendly and easily customizable dashboards provide businesses the flexibility to choose the right metrics to monitor and analyze. They ensure that all the necessary information is accessible in one place, enabling swift decisions and quick response times.
Overall, the power of data visualization lies in its ability to turn data into actionable intelligence. It is a crucial tool that helps businesses improve decision-making, uncover hidden insights, and deliver a significantly higher ROI on their data investments.


