BCG Growth Share Matrix: What Is It?
The BCG matrix is a framework that helps businesses make long-term strategic plans by helping them better unders
The strategic business units (SBUs) or products of a company are plotted on a four-square matrix using the BCG matrix structure.
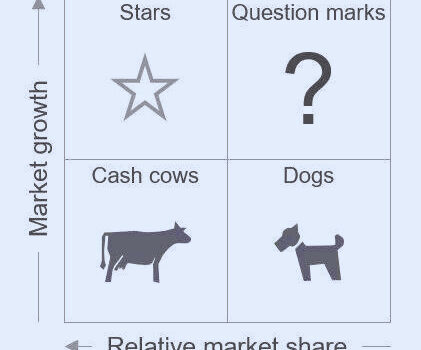
structure of the BCG matrix
X-Axis → Relative Market Share; Y-Axis → Market Growth Rate
The BCG matrix has the following four quadrants:

Cash Cows: High Market Share, Low Growth
Stars: High Market Share; High Growth
Question Marks: High Market Share; Low Growth
dogs: Low Market Share, Low Growth
tand the competitive landscape of a market, both now and in the future.
Cash Cow 1 in the BCG Matrix:
In an industry that is experiencing slow growth, companies with a large market share are referred to as “Cash Cows.”
These businesses don’t have a problem with liquidity or profitability.
One disadvantage is that due to the markets’ maturity, there are few opportunities for reinvestment or market expansion, making these companies profitable but uninteresting overall.
For these kinds of businesses, the overall amount of work and reinvestment activity needed to maintain the historical levels of cash generation is negligible.
Star in Quadrant 2 of the BCG Matrix:
Businesses in a high-growth industry with a large market share are categorized in the “Star” quadrant.
Star products are thought to be the best options for investors looking for the highest risk-adjusted returns because they have a high market share, strong historical growth, and a pipeline of promising future opportunities.
These businesses typically offer specialized goods or services and have a distinct competitive advantage, or “moat.”
Naturally, spending is a prerequisite for high growth, so reinvestments are required to keep growth momentum high.
The stars would ideally become cash cows once the company’s growth slows and its position in the market stabilizes.
Question Mark in Quadrant 3 of the BCG Matrix:
Businesses in a high-growth market with a low market share are referred to as the “Question Mark.”
Since these businesses are not industry leaders, substantial investment is required for them to expand and displace established players in the market.
The company’s future is totally dependent on its ability to gain market traction and execute well, so it is impossible to predict the potential upside or downside.
Pets in the BCG Matrix, Quadrant 4:
More politely referred to as pets, dogs represent a small portion of the market in a developed sector that is expanding slowly. Usually producing “break even” revenue, these units barely make enough money to keep the company’s market share. Even though having a break-even unit benefits society by creating jobs and perhaps fostering synergies that benefit other business units, such a unit is worthless from an accounting perspective because it does not bring in money for the company. They lower a profitable business’s return on assets ratio, which is a popular metric among investors to assess management quality. It is believed that after short-term harvesting has been optimized, dogs should be sold.
A BCG Growth Matrix example:
We can use the growth matrix in a wide range of real-world businesses. Apple Inc. (AAPL) is an excellent option. Let’s examine the products that Apple offers based on the matrix categories:
Star: iPhone
MacBook is a cash cow.
Apple TV: A question mark
Canine: iPad
Growth vs. Relative Market Share:
Low Growth, High Share: Businesses should take advantage of these money makers to raise funds for other investments.
High Growth, High Share: Given their enormous future potential, businesses ought to make substantial investments in these stars.
High Growth, Low Share: Depending on their likelihood of becoming stars, businesses should either invest in or ignore these question marks.
Low Growth, Low Share: These pets should be repositioned, sold, or liquidated by companies.
How Is the BCG Matrix Operational?
Using a 2×2 grid, the BCG Growth-Share Matrix evaluates a company’s potential for growth as well as its available market share. Executives can then determine where to focus their resources and capital to generate the most value and where to cut their losses by classifying each business into one of these four categories.
Is the Real World Using the BCG Matrix?
The growth share matrix was utilized by nearly half of Fortune 500 companies at the height of its popularity, according to BCG, and it remains a key component of business strategy courses at business schools today.
for more information visit our Homepage


